







-
Frequently Asked Questions
-
All About Features
- How to Install the Tracking Code
-
User Guides
-
Integrating With Other Platforms
-
Legal, Data Privacy & Certificates
- TWAIA Addendum
- White Label Analytics
- Glossary
- Contact
Competition
Compare Your Website’s Performance to Others in Your Industry
- What It's All About
- Set the Date
- Some General Hints
- Setting Up the Competition Module
- Filters for the Competition Submodule
- Visitors & Pageviews Comparison
- Browser Usage – Comparison by Page Views
- Operating System Usage – Comparison by Page Views
- Screen Resolution Usage – Comparison by Page Views
- Device Usage – Comparison by Page Views
What It's All About

In the Competition submodule, you can compare your own website’s performance data against the respective averages generated by competing websites of a region and business sector you can select.
Once you have selected a region and a business sector in the upper section of the module against which you want to compare your own website data, the platform automatically calculates the average values of the displayed metrics (visitors, page views, browsers, etc.) for all websites in the platform database that correspond to the country and business sector you have selected. The resulting average values are then visually compared with the data from your own website.
The number of websites included in the calculation of the displayed average values always depends on your selection of the region and business sector to be compared. However, data from hundreds of thousands of websites is usually included in the calculations. The website you have selected is NOT part of the competitor average.
Important Notes:
- Ideally, the region and business sector defined for your own website should be as accurate as possible. You can update the options selected for your website at any time. However, to ensure the best possible data quality for all platform users, these field selections should remain as consistent as possible.
- The selection of countries and industries of competitors against which you want to compare your own website data can, of course, be adjusted at any time without compromising data quality.
- Fields already defined within the module are retained when you exit the module and return to it later.
- You can also combine all countries with all economic sectors to see how your website performs compared to all websites that use our platform—regardless of their economic sector and/or region.
Set the Date
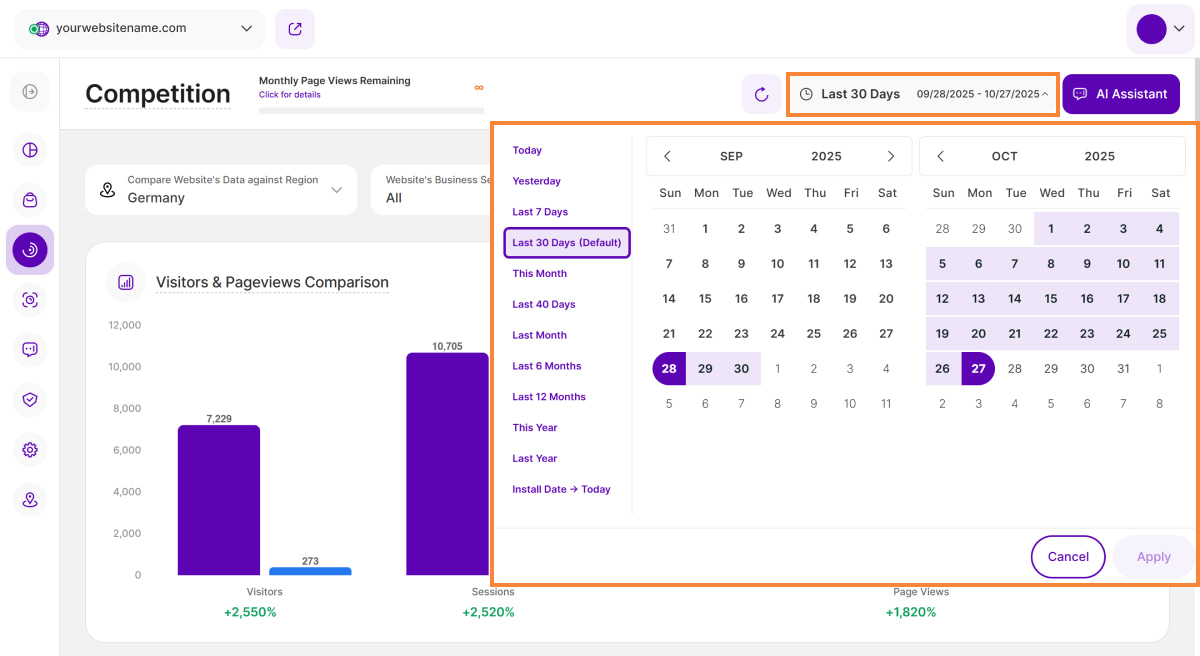
Right above the tiles, you can see a date selector icon. Use it to pick a time period or specific day for the Dashboard's data.
It's important to focus on dates when you ran campaigns or strategies. This helps evaluate their effectiveness and plan for the future.
Important Notes:
- The date picker lets you pick the earliest possible start date, August 1, 2020, and will soon support even older dates.
- If your site had a data reset after that date, then the start date for the data analysis will be from the reset date.
- For accuracy, we recommend comparing the competition's performance up to 24 hours ago, as current-day calculations occur at day's end.
- The app now remembers previously set segments, filters, filter templates, and date intervals, even when you navigate away from the page, log out, or log back in. When your session expires or you close the tab, it automatically switches back to the default setting of "Last 30 Days."
Some General Hints
- The module's report blocks only display metrics for which your website has collected data, regardless of whether competitors have collected data for these metrics.
- If your website has not recorded any visits during the selected period, there is no data that can be compared with that of your competitors. In this case, the platform will display the message "There is no data for the selected period or the set filters," and you will only see the overall comparison based on visitor numbers and page views.
- You can easily customize the sorting of a report block by displaying either the top values of your website or the top values of your competitors at the top.
- At the bottom of each report block, you will find the "Load more" button. When you click this button, the report will expand downward and display all additional data that was not previously visible.
- Filters are available for all report blocks: they ensure consistent access to data segmentation throughout the module.
- Customize the number of entries shown per page and easily navigate the dataset using pagination.
Setting Up the Competition Module

The "Competition" module helps you compare the performance of your website with other websites in your industry and region. After selecting the Competition option in the main navigation bar for the first time, a welcome screen will appear. To start viewing the competition data, please define the region or business sector of your own website in this view and then click Continue.
Filters for the Competition Submodule
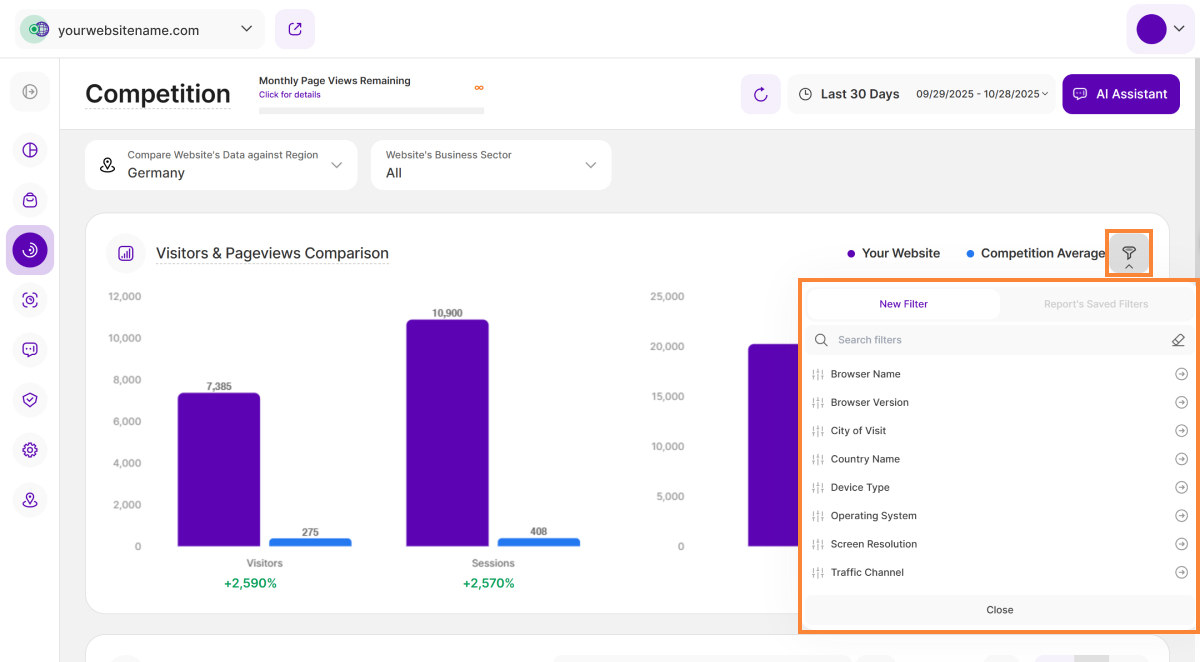
The Competition submodule provides invaluable insights, and filters are the key to unlocking a granular understanding of your performance. They are consistently available across all report blocks, giving you the power to apply one or more at once to segment and analyze your website's data with high precision.
| Filter Category | What It Filters and Why |
| Browser Name | Filter the data by their browser to help you check if your site is underperforming compared to competitors on key browsers like Chrome or Safari. |
| Browser Version | Filter by browser version to isolate and analyze technical discrepancies in performance between your site and competitors on specific software updates. |
| City of Visit | Filters by specific city to allow for granular geographic benchmarking against competitors operating in those precise metropolitan areas. |
| Country Name | Filter by country to set the competitive baseline, ensuring your benchmarking data is relevant only to your primary national market. |
| Device Type | Filters by hardware (Mobile, Desktop) to allow a direct comparison of your visitor volume and engagement against the competitive average for that device type. |
| Operating System | Identify and prioritize fixes for any technical issues on specific platforms where your competitors maintain strong performance. |
| Screen Resolution | Filter by screen resolution to assess how well your responsive design performs on popular screen sizes relative to your competitors' audience experience. |
| Traffic Channel | Filter by traffic channel (e.g., Organic Search, Paid Ads) to measure your marketing efficiency and performance on a specific channel against the competition's channel averages. |
To start filtering, simply click the filter icon. Next, choose your first filter criterion (e.g., "Country Name"), select the specific value you want to focus on (e.g., "United States"), and then click Submit. Once your first filter is applied, you can add more by clicking the Add New Filter button to refine your search further. If you need to remove any filters, click the minus icon (-) next to it, or select Remove All Filters to start fresh.
Visitors & Pageviews Comparison

This report block visualizes how your website’s visitor and page view numbers stack up against other sites in your industry and country. The data shown is dependent on the time period you select using the date picker, which is located on the top right near the AI Assistant button.
At the top left of this view, you can use two drop-down menus to define the region and business sector with which you want to compare the data from your own website. Your selection determines the pool of competitor data that is used to calculate the averages of the comparison metrics displayed:
- Region: The first dropdown allows you to select your competitor's region (e.g., Germany).
- Business Sector: In the second drop-down list, you can select the relevant industry with which you want to compare your own website data (e.g., All business sectors, as shown in the example).
The report highlights three core metrics, presented in separate charts for a clear and direct comparison between Your Website (purple) and the Competition Average (blue):
- Visitors: The sum of all types of visitors (new, returning, and converting) that have visited your website during the selected date or period.
- Sessions: The total number of sessions to your website.
- Page Views: The combined count of all pages viewed on your website.
To gain granular insight, click the filter icon in the top right corner. This allows you to immediately segment the entire competitive report by criteria (like Browser Name or Device Type), ensuring your benchmarking data is highly specific.
Browser Usage – Comparison by Page Views

This report block compares how many page views were generated on your website using a specific browser with how many page views on average were generated using that browser on competing websites (based on your selection of region and business sector further up). The data displayed is directly dependent on the timeframe you set in the date picker.
It uses horizontal bar chart to provide a clear visual comparison between your website and the Competition Average, using two key data points for each browser:
- Your Website (Purple Bar): The total page views generated by visitors using that specific browser (e.g., Chrome, Safari, Firefox) during the selected time period.
- Competition Average (Blue Bar): The average number of page views generated by visitors using that browser across all websites in your defined competition group.
Use the filter icon (top right) to apply instant segmentation by criteria (like Browser Name or Device Type), giving you the precision needed for specific competitive analysis.
Operating System Usage – Comparison by Page Views
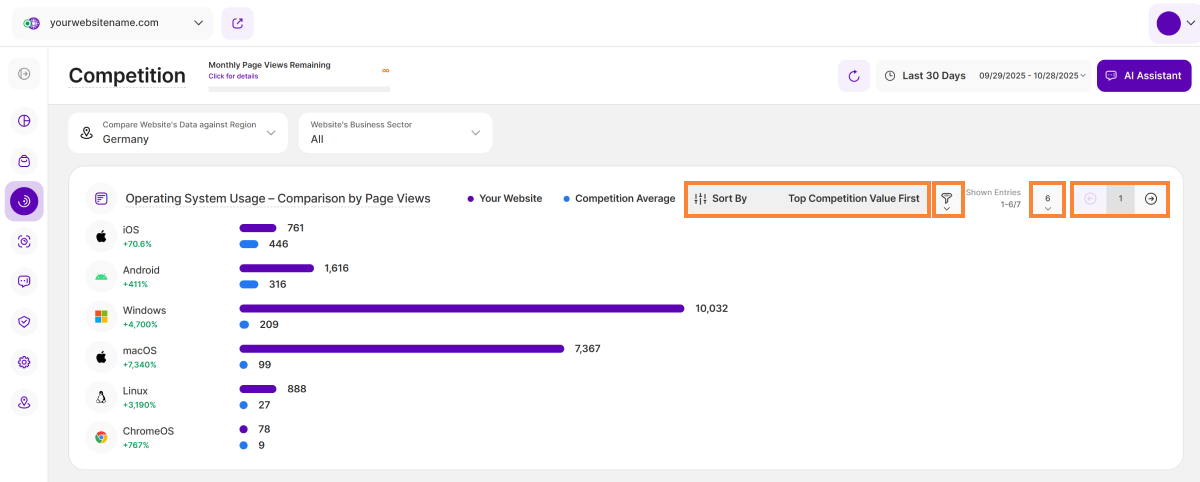
This report block compares how many page views were generated on your website using a specific Operating System with how many page views on average were generated using that operating system on competing websites (based on your selection of region and business sector further up). The metrics shown are entirely dependent on the time frame selected using the date picker (located on the top right).
A horizontal bar chart illustrates a direct visual comparison between your website and the Competition Average, highlighting two key data points for each browser.
- Your Website (Purple Bar): The total page views generated by visitors using that specific Operating System (e.g., Chrome, Safari, Firefox) during the selected time period.
- Competition Average (Blue Bar): The average number of page views generated by visitors using that Operating System across all websites in your defined competition group.
For the precision needed in competitive analysis, click the filter icon to instantly apply segmentation based on criteria like Country Name or Traffic Channel.
Screen Resolution Usage – Comparison by Page Views

This report block compares how many page views were generated on your website using a specific screen resolution with how many page views on average were generated using that screen resolution on competing websites (based on your selection of region and business sector further up). The data displayed is directly dependent on the timeframe you set in the date picker.
Control the report data by using the date picker to set the exact time range you wish to analyze.
The report uses two distinct data sets for immediate visual comparison:
- Your Website (Purple Bar): Shows the Page Views recorded for each specific screen resolution on your site.
- Competition Average (Blue Bar): Represents the Page View average for the same screen resolutions across all competing websites in your selected region and business sector.
For a more focused analysis, filter the data using your desired criteria. To manage large datasets, you can customize the number of entries shown per page and use pagination for easy navigation.
Device Usage – Comparison by Page Views

This report block compares how many page views were generated on your website using a specific device type with how many page views on average were generated using that device type on competing websites (based on your selection of region and business sector further up). The data displayed is directly dependent on the timeframe you set in the date picker.
The report uses a horizontal bar chart with two distinct data sets for immediate visual comparison:
- Your Website (Purple Bar): Shows the total Page Views recorded for each specific device type on your site.
- Competition Average (Blue Bar): Represents the Page View average for the same device type across all competing websites in your selected country and business sector.
To focus your analysis, sort the data to prioritize either your top values or the competition's top values. You can also filter the data to segment it for a competitive edge. Finally, manage your view by setting the number of entries per page and navigating with pagination.
